
Capacity Balance Market: A plunge to zero in 2020?
In our first blog entry of the year, we discussed the 10 trends to watch in the Mexican energy sector throughout 2021. Among these, our team forecasted the Capacity Net Price would plunge to zero during the 2020 Capacity Balance Market (MBP)1 exercise.
However, CENACE’s final results, published this past February 26th, show a different outcome. How is the Capacity Net Price calculated, and why our previsions were discrepant this year? What is the future of the MBP under the new regulatory scenario? Read on and find out!
First of all, what is the Capacity Balance Market (MBP)?
According to the IEA1, capacity markets are mechanisms where a system operator procures or imposes capacity requirements (in MW) to ensure system adequacy in the future. This capacity does not have to actually produce electricity, but must be available in case of need2.
In Mexico, the MBP is an ex-post market that takes place every February for the previous year of production. Its main objective is to send the market signals that motivate investment in novel capacity to cope with the rising electricity demand4. This is done by defining a Capacity Net Price, that is meant to:
👉🏾 Reward available Generators (Capacity Accreditation): CENACE pays the Generators that were available during the 100 critical hours of the system5.
👉🏾 Imposing Capacity requirements for Consumers (Capacity Requirement): CENACE calculates a Capacity requirement (also associated to the 100 critical hours of the system) that must be met by each Load Serving Entity (ERC)6.
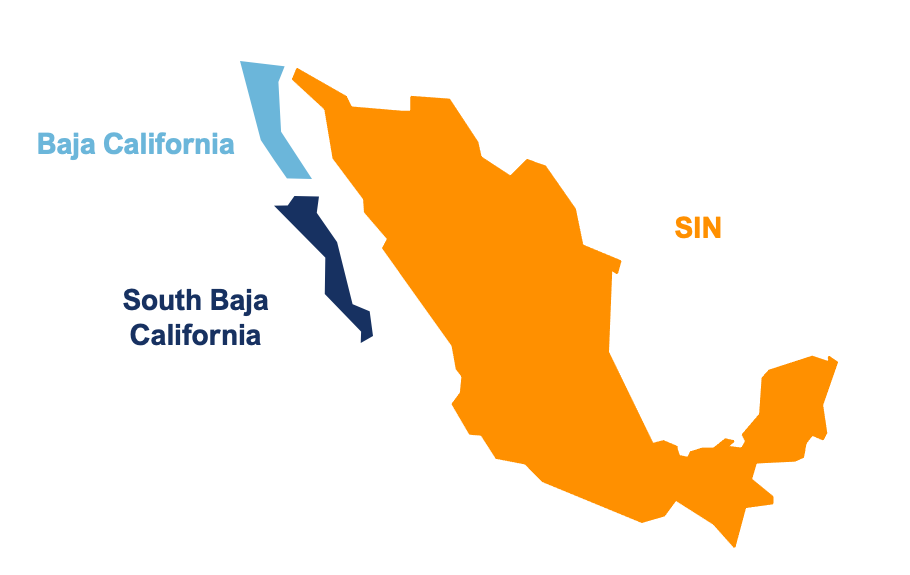
The MBP is calculated for three Capacity Zones (SIN, BCA, and BCS), corresponding to the three sub-systems of the National Electric System (SEN)7.
How is the Capacity Net Price defined?
Preliminary results of the MBP are published at the end of the production year8, whereas final results are published before the end of February of the next year. CENACE follows several steps to define the Capacity Net Price. Each of them is described below:
⚡️ Definition of the 100 Critical Hours
Based on the MBP Manual, CENACE calculates the 100 Critical Hours for each Capacity Zone. In general terms, these represent the hours when the system is most stressed. For the 2016 and 2017 exercise, the Critical Hours reflected the maximum demand of the Capacity Zone in question. As of 2018, Critical Hours reflect the 100 hours with the minimum generation reserves
⚡️ Definition of Capacity Requirement
For each ERC, CENACE determines a Capacity Requirement that must be met through PPAs or purchases at the MBP. This amount is calculated based on each ERC demand (averaged for the 100 critical hours), plus Planning Reserves percentages defined by the CRE.
⚡️ Definition of Capacity Accreditation
Given the availability to deliver energy to the grid, CENACE classifies power plants between firm and intermittent. Thus, capacity recognition for firm assets (mostly thermal) is based on their average availability during the system’s critical hours. On the other hand, intermittent power plants are measured by their average generation during the 100 critical hours
⚡️ Generation Technology of Reference (TGR)9 Definition and Calculation of its Market Incomes
CENACE defines a Technology of Reference per Capacity Zone. This technology has to be commercially replicable at large scale, and cost-efficient (must minimize net generation and Capacity costs in the long-term run). To date, this technology is an industrial gas turbine using natural gas as main fuel in the SIN.
Then, the following calculations are executed:
- TGR Levelized Fixed Costs,
- TGR Incomes (IMGTR), based on its variable costs and market prices.
The latter involves, as per the manual, averaging out the nodes of the system where the TGR is present. However, CENACE has opted for the selection of a specific node to determine the PML used in this calculation. Historically this node was Rio Bravo (06RIB-138), but in the 2019 MBP exercise CENACE changed it to Altamira (06PAE-400)
⚡️ Calculations of Capacity Closing and Net Prices
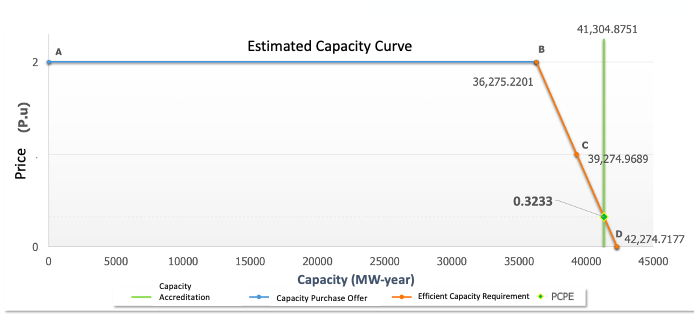
Based on all the previous steps, CENACE calculates the Capacity Closing Price, depending on the TGR Levelized Fixed Costs, the Minimum and Efficient Capacity Requirements, and Capacity Accreditations as defined in the example below:
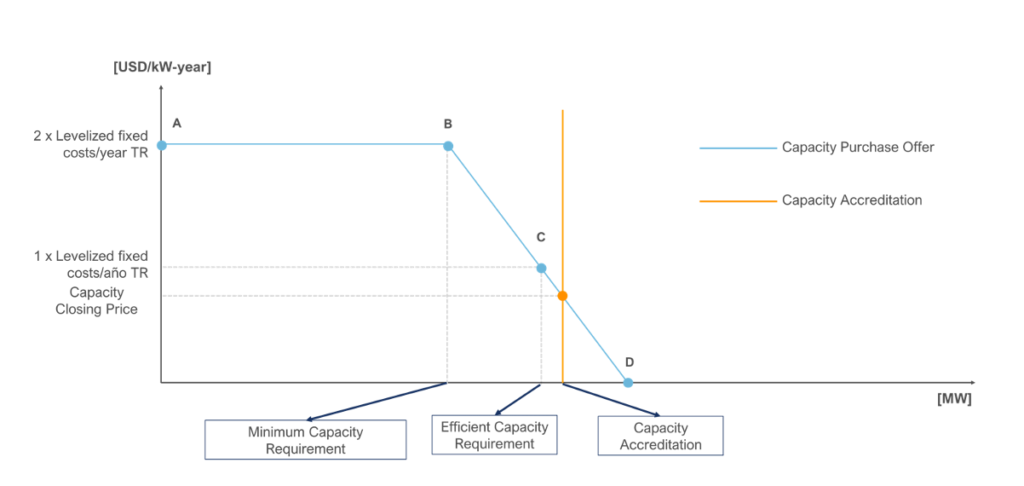
The intersection between Capacity Requirements and Accreditation is the Capacity Closing Price.
👉🏾 If the Capacity Accreditation is lower than the Minimum Capacity Requirement (point B), there is a shortage of Capacity, and the Capacity Closing Price is capped at 2x the TGR Levelized Fixed Costs.
👉🏾 On the other hand, if the Capacity Accreditation is higher than point D, there is an over-supply of Capacity in the market, and the Capacity Closing Price is thus 0.
Finally, CENACE takes this Capacity Closing Price and subtracts the IMTGR to obtain the Capacity Net Price, that is the price at which Capacity will be exchanged within the market participants.
This means that if the IMTGR is greater than the Capacity Closing Price, then the Capacity Net Price falls to USD 0/MW-year.
The following table shows the MBP results for the last five MBP exercises in the SIN Capacity Zone:
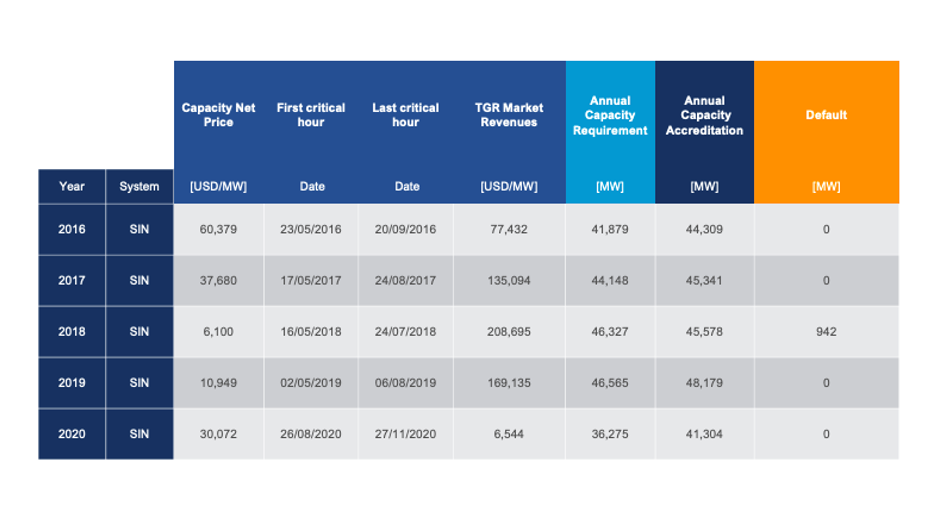
So far, the results are the following:
⚡️ Both the Capacity Requirement and Capacity Accreditation have increased, maintaining a balance. However, the Capacity Requirement has grown more rapidly, causing the first ever MBP default in 2018. However, in 2019, the Capacity Accreditation increased by 2.6 GW due to newly installed capacity. (Once again, more than +10 GW were installed in that same year!)
⚡️ As per the above, the Capacity Net Price has been decreasing due to the PML rise, and hence, an associated increase of the IMTGR. This changed in 2019 as the Capacity Net Price experienced a slight increase when CENACE changed the node to calculate the IMTGR. Without this change, Capacity Net Price would have fallen to USD 0/MW.
⚡️ While the Capacity Net Price has sent the right market signals since 2016 (except for the 2018 exercise, where this price was around 6,000 USD/MW-year). However, between 2017 and 2018 PMLs did reflect the need of investing in novel capacity, until the 2H19 when its value decreased dramatically.
In conclusion, the changes CENACE introduced to the calculation methodology, while perfectly legal and fair, make the Capacity Price unpredictable and difficult to use to finance projects.
What are the main takeaways from the 2020 MBP Exercise?
In the past weeks, CENACE published preliminary results of the 2020 MBP exercise. In our role as market advisors, we forecasted the Capacity Net Price would plunge to zero in such an atypical year. Why? Because of an over-supply of Capacity Accreditation as compared to the Capacity Requirement. In simple terms:
If Capacity Accreditation > Capacity Requirement Capacity Net Price = 010
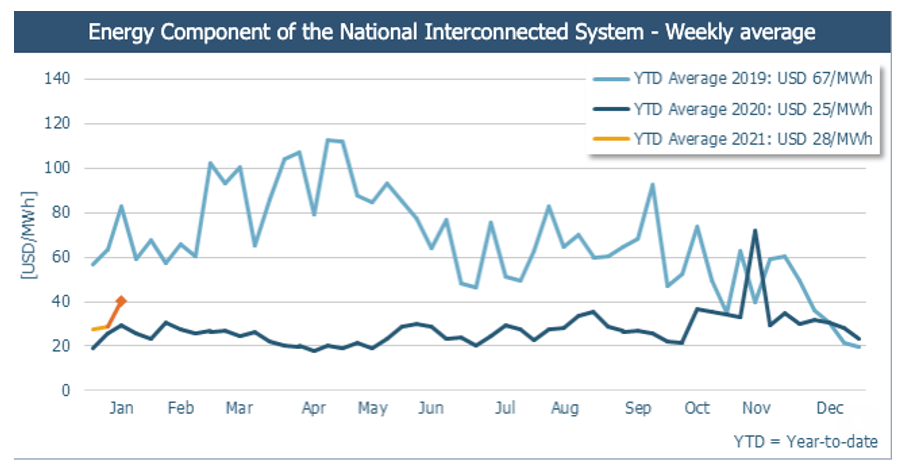
This means the SEN was supported by a greater capacity that what was actually needed. In 2020, we experienced a rampant decrease in electricity demand11 due to the sanitary crisis, and hence, the fuel price shock. On top of this, as we explain in our COVID-19 Impact on PMLs blog entry, the addition of +10GW caused a generation/demand imbalance. The result? A less stressed system with PMLs around 30 USD/MWh for most of the year.
On January 29th, 2021, CENACE published the final report for the Technology of Reference, with the objective to determine its generation costs, as well as the node used to calculate the market revenues for the 2020 exercise.
In this publication, the TGR calculation assumptions did not change (as compared to the previous years):
⚡️ Reference Generation Technology for the SIN: Gas Turbine – Industrial type. No change.
⚡️ Reference node location: 06PAE-400 (Puerto Altamira). No change.
⚡️ Levelized fixed cost of the Reference Generation Technology: 2% decrease. In previous calculations (2019) these costs were USD 120,401/MW. New considerations, including diverse technical variables, changed the TGR cost to USD 118,538/MW.
However, both the Capacity Maximum Price preliminary report12, and its final version13 indicated a different outcome from what we initially expected. Instead of declaring the system in over-capacity, CENACE calculated the intersection between supply and demand at 0.323314 within the SIN. As such, the Capacity Net Price is equal to USD 30,072/MW – year.
While CENACE did not change the methodology this year, our discrepancy VS the actual results comes from the definition of the 100 critical hours of the system. In yet another example of a lack of transparency, CENACE does not publish the actual critical hours of every year but rather only a window when these took place. Hence, Antuko does not have access to the same data CENACE uses as a basis to calculate the system’s 100 critical hours. The question then is: How does CENACE calculates this window?
In order to understand this, it is important to take note on the following concepts:
👉🏾 100 Real Critical Hours = 100 hours where the system operated under minimum reserves
👉🏾 100 Firm Critical Hours = ± 14-day window, where the 100 real critical hours of the previous year fall
For instance, in the 2020 exercise, CENACE takes as a starting point the day when the first critical hour took place in 2019, and subtracts 14 days. This date is considered as “the first day of calculus”. In this same line, CENACE takes as a starting point the day when the last critical hour took place in 2019, and sums 14 days, being this date the “last day of calculus”.
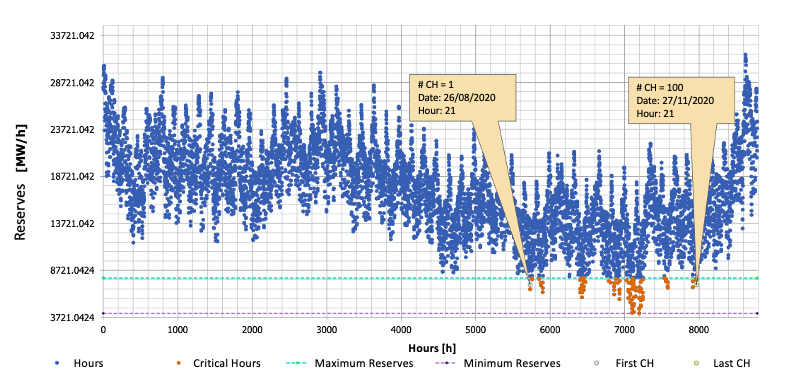
While in past editions of the MBP exercise this window took place between May and August, during 2020 it was placed between August and November! Being such an atypical year in terms of demand, the Summer was not as critical as most regions were under heavy lock-down measures.
Instead, the critical hours of the system moved toward the end of the year when the system was operating under stress conditions due to Grijalva river floods and maintenance works in Laguna Verde. The Antuko model was unable to predict such unexpected events. The fact that CENACE does not publish the system’s Real 100 Critical Hours makes its forecasting a quite complicated task!
Nevertheless, such discrepancy was minor, and in the coming days Capacity liquidations should take place between MBP market participants.
This series of events raise very interesting points toward the future. First of all, If the MBP 2020 Real Critical Hour window took place between August and March, how will this impact the definition of the 100 Firm Critical Hours for the next MBP exercise? Under such conditions, changes in the calculation methodology are expected.
But most importantly, does further editions of the Capacity Market make sense at all? Let’s remember the Preferential Law initiative that was recently approved by the legislative branch seeks to prioritize CFE over private generation within the dispatch curve model. The utility owns most of the thermal assets in the country that receive Capacity Accreditations at the MBP. If these are dispatched first, is a Capacity Market needed after all?
The current administration holds over 180 days to issue the new regulatory framework that will govern these changes. In the meantime, many injuctions, unconstitutionalities, and even international arbitrages are expected to take place in the following days. Curious about its impact? In Antuko, we are studying the proposed changes and our team can help you understand them! Contact us at: mexico@antuko.com
[1] MBP (per its acronym in Spanish)
[2] Source: https://www.iea.org/reports/introduction-to-system-integration-of-renewables
[3] In Mexico, this availability is shown by submitting a selling offer at the Day-Ahead Market (MDA).
[4] In Mexico, yearly electricity demand grows by 3%, strongly associated to the GDP.
[5] Generators must make their best efforts in order to be available during these critical hours.
[6] ERC (per its acronym in Spanish)
[7] SEN (per its acronym in Spanish)
[8] For instance, the preliminary version of the Maximum Capacity Price was published on December 21st, 2020.
[9] TGR (per its acronym in Spanish)
[10] In fact, this equation is the following: Capacity Accreditation > (Minimum Requirement + 2*(Efficient Requirement – Minimum Requirement))
[11] In 1H20 only, demand fell around 10% VS 2019 levels!
[12] Published on December 21st, 2020 by CENACE
[13] Published on January 30th, 2021 by CENACE
[14] This is the maximum price that Capacity can have, based on the Estimated Closing Capacity Price, and discounting the market revenues from the Technology of Reference.