
Full 2020 Portuguese solar auction results
A few days ago, we published a short note to help Deciphering the August 2020 Portuguese solar auction. Since then, the Portuguese government published the full results. Here follow our main observations.
PV plus storage wins 72% of awarded capacity
A total of 14 projects were awarded and will result in the construction of 14 solar plants. 8 of them will include storage, and they represent 72% of awarded capacity.
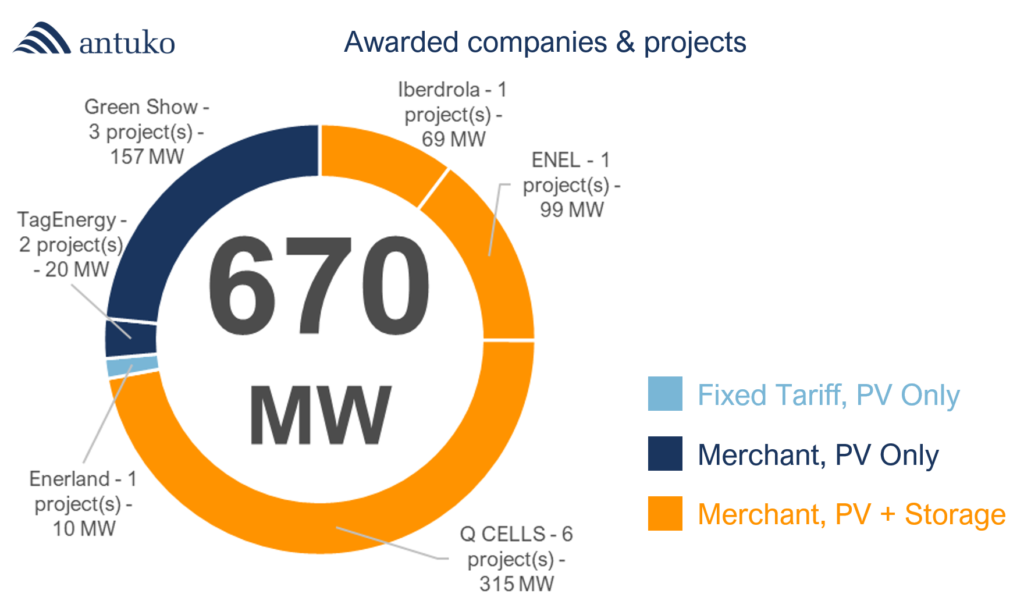
Considering the minimal storage capacity to participate to the tender (20% of PV plant power, and 1h capacity), this will result in the installation of at least 97 MW of battery storage, with at least 97 MWh of capacity.
Bids comparison: the world record is not that competitive
As we explained more deeply in our previous publication, in order to compare the bids presented to the tender the Portuguese authorities calculate the Net Present Value (NPV) of each bid, expressed in [EUR/MW], and award the ones that offer the highest income to the Portuguese system.
This graph illustrates the NPV of the awarded bids from the SEN’s perspective, for each company, using a weighted average for companies with more than one awarded project. Companies are ranked from the most competitive (above) to the less competitive (below).
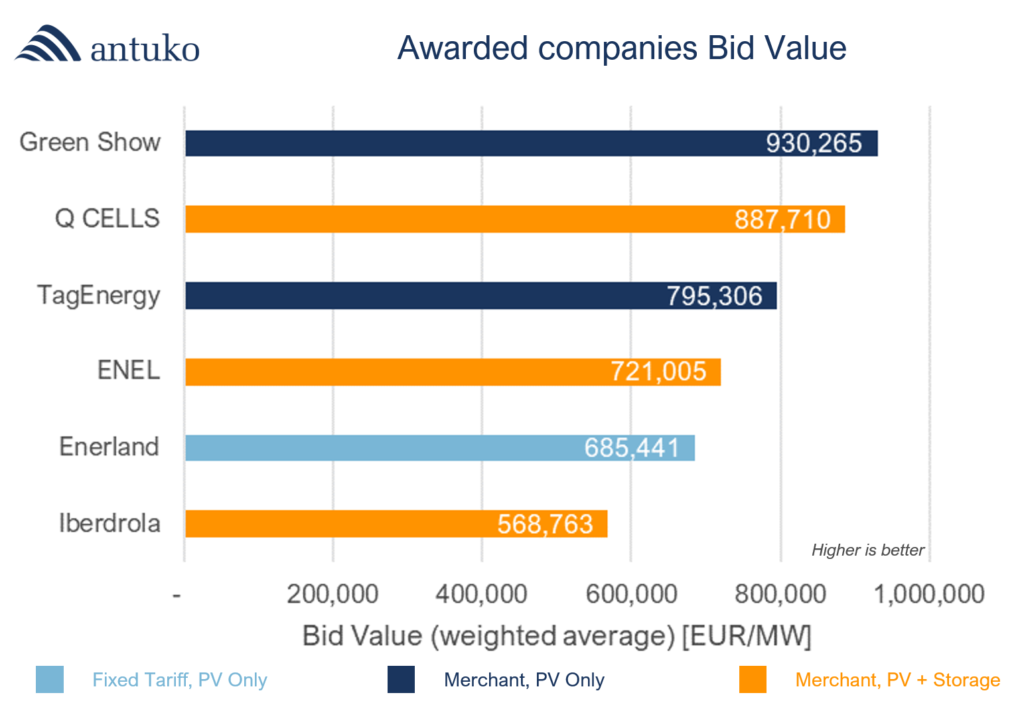
The most competitive company was Green Show, with an equivalent payment of EUR 930,265/MW, in Merchant PV Only option.
The less competitive company was Iberdrola, with an equivalent payment of EUR 568,763/MW, in Merchant with storage option.
There are many statements to learn from these results:
- Looking at bid value ranking, the low price world record of Enerland, with EUR 11.14/MWh is only the 5th most competitive.
- The two Merchant PV Only awarded companies are among the most competitive.
- From the SEN point of view, all these projects result in an equivalent income of EUR 559 million (EUR 834,425/MW).
Bids “translation” to a [EUR/MWh] reference price: storage has a clear advantage
The NPV figures used by the Portuguese authorities to compare the offers and award contracts are a bit opaque to the energy sector which prefers to understand expected revenues in [EUR/MWh] terms.
In order to translate these [EUR/installed MW] payments into [EUR/MWh] expected revenues two estimations need to be made:
- The production of the plants, i.e. a yearly plant factor. In order to compute the following figures, we estimated a normalised annual plant factor of 25%, i.e. 2.190 hours.
- The expected solar captured prices over the 15 years horizon. In order to compute the following figures, we used our own long term solar captured price projection (forecasted in July 2020)
The following graph shows for each awarded company the expected cash flows expressed in [EUR/MWh], ranked from the highest expected revenues (left) to the lowest (right). For the companies with more than one project, we use a weighted average. The grey area represents the yearly contribution these companies will have to pay to the SEN (merchant options), and the light blue area the Storage extra incomes (from load shifting and Ancillary Services), when applies. The dark blue area represents income from the energy sale to the wholesale daily market (OMIE) which is variable in the Merchant cases and capped to EUR 11.14/MWh in the case of Enerland. Finally, the orange dot represents the net expected revenue expressed in [EUR/MWh] terms.
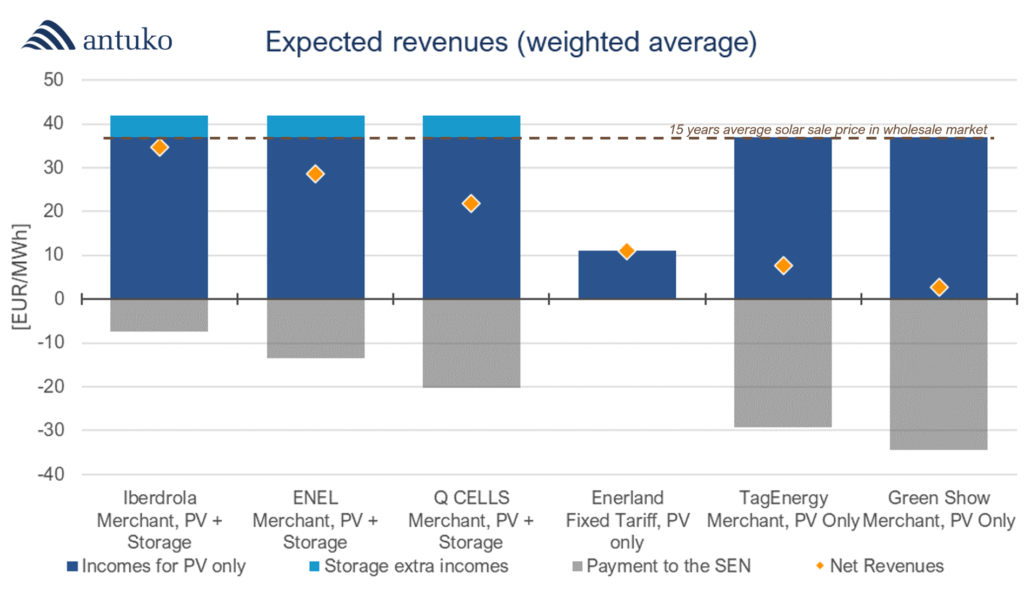
Iberdrola, with its less competitive bid will earn the highest revenues: almost EUR 35/MWh!
The two other companies that also won with PV plus storage, ENEL and Q CELLS follow with the second and third positions.
Then follows the project of Enerland, low price world record for a Fixed Tariff.
At the end we find the two companies that chose the Merchant PV Only option, expected revenues may be even lower than Fixed Tariff case: between EUR 2.7 and 7.7/MWh! This is mainly due to the high cost of the Payment to the SEN.
To discuss these results:
- Plant factor has a strong impact on revenues here (to reduce the equivalent cost of the Payment to the SEN).
- Also, market price expectation of the bidders may have been quite different to our view here, resulting in potentially higher expected revenue.
Then, it is worth reminding the importance of considering the right inputs when building a bid strategy, to avoid critical situations!
Conclusions and opinion: the cost of competitiveness
As we concluded in our previous note, these figures clearly prove, one more time, that solar is a mature technology that can generate energy at extremely low prices.
It also shows that solar combined with storage is price competitive and definitely can be used in order to better distribute the energy generated by solar plants as well as help grids stability.
But this tender also proves that there is a lot of competition among developers and that securing connection access to grids together with a strategic positioning in a particular country can have a very high cost (which may be under-estimated). Why else would one decide to pay an equivalent of EUR 570,000 to EUR 930,000/MW installed, almost doubling the Capex of these projects, in order to be simply exposed to merchant, i.e. the same as any other project developed in Spain?