
Deciphering the August 2020 Portuguese solar auction
Methodology and results
Bidding options
The Portuguese 2020 solar auction offered to the bidders two ways to sell their energy:
- The first one is perceiving a Fixed Tariff (a constant fixed price for all their production) over 15 years, for PV only, without storage.
- The second one is selling the production Merchant, i.e. receiving the wholesale price (i.e. the variable OMIE Daily Market price). In this Merchant option, the bidders could present offers with or without storage.
Understanding cash flows
In both cases the awarded solar plants will receive their primary revenues from the daily sale of their production to the wholesale market (OMIE) as any other plant operating in the Iberian market.
In the Fixed Tariff option, the awarded solar plant will have to pay back to the National Electrical System (SEN in Portuguese) any revenues that exceed the awarded Fixed Tariff, and will receive from the SEN the missing revenues in case the average Daily Market Price they received from OMIE is lower than the awarded Fixed Tariff.
In the Merchant options, there is absolutely no hedge for the plants: they will simply receive their own daily captured price (i.e. price weighted by their hourly production), to which they will have to subtract a yearly contribution (expressed in [EUR/MW/year]) that they will need to pay to the SEN. This yearly contribution is to be understood as the cost these plants are willing to pay in order to secure a connection point to the Portuguese electricity grid.
Bids comparison
In order to compare the bids presented to the tender the Portuguese authorities calculate the Net Present Value (NPV) of each bid, expressed in [EUR/MW], and award the ones that offer the highest income to the Portuguese system.
For Fixed Tariff option, this NPV is calculated as the difference between the bid’s Fixed Tariff and the expected 15 years of Daily Market price (based on an electricity price forecast which was published by the Portuguese authorities in the tender reference documents). This difference is then multiplied by the expected theoretical generation of each project in order to obtain the revenues in [EUR/MW], and then calculate their Net Present Value.
For Merchant options, it is easier, as the bids are directly expressed as a payment in [EUR/MW] to the system: the bids value are the NPV of 15 years of contribution. For the case of Merchant with storage option, the bids had to take into account a “Flexibility Payment” to be received from the system in order to balance the extra cost of storage (compared with the solar-only option). In that case, the bidders incorporated in their offers a discount to this Flexibility Payment, which was the case of the bids of Enel and Q-Cells.
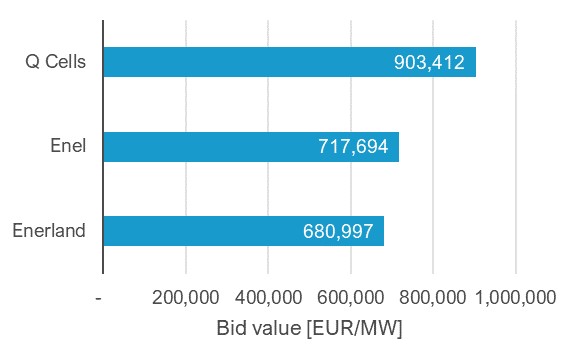
This graph illustrates the NPV of the awarded bids from the SEN’s perspective:
- Q Cells’ offer amounts to a payment of EUR 903,412/MW installed.
- Enel’s offer amounts to a payment of EUR 717,694/MW installed.
- Eerland’s offer amounts to a payment of EUR 680,997/MW installed.
Bids “translation” to a [EUR/MWh] reference price
The NPV figures used by the Portuguese authorities to compare the offers and award contracts are a bit opaque to the energy sector which prefers to understand expected revenues in [EUR/MWh] terms.
In order to translate these [EUR/installed MW] payments into [EUR/MWh] expected revenues two estimations need to be made:
- The production of the plants, i.e. a yearly plant factor. In order to compute the following figures, we estimated a normalised annual plant factor of 25%, i.e. 2.190 hours
- The expected solar captured prices over the 15 years horizon. In order to compute the following figures, we used our own long term solar captured price projection
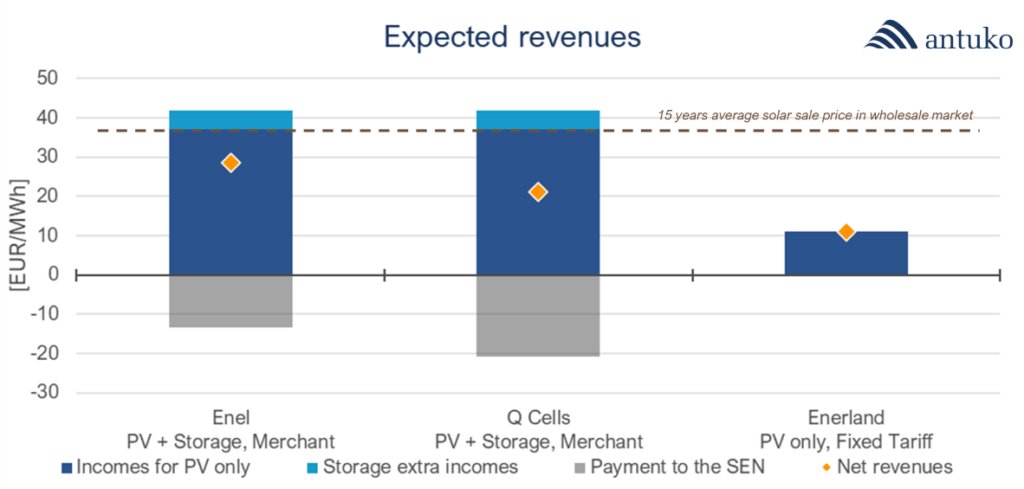
The following graph shows for each awarded project the expected cash flows expressed in [EUR/MWh]. For the case of Enel and Q Cells the grey area represents the yearly contribution these projects will have to pay to the SEN, and the light blue area the Storage extra incomes (from load shifting and Ancillary Services) they will receive. The dark blue area represents income from the energy sale to the wholesale daily market (OMIE) which is variable in the case of Enel and Q Cells and capped to EUR 11.14/MWh in the case of Enerland. Finally, the orange dot represents the net expected revenue expressed in [EUR/MWh] terms: EUR 11.14/MWh for Enerland, slightly above EUR 20/MWh for Q Cells, and around EUR 28/MWh for Enel.
Conclusions and opinion
These figures clearly prove, one more time, that solar is a mature technology that can generate energy at extremely low prices.
It also shows that solar combined with storage is price competitive and definitely can be used in order to better distribute the energy generated by solar plants as well as help grids stability.
But this tender also proves that there is a lot of competition among developers and that securing connection access to grids together with a strategic positioning in a particular country can have a very high cost. Why else would one decide to pay an equivalent of EUR 680,000 to EUR 900,000/MW installed, almost doubling the Capex of these projects, simply in order to be exposed to merchant, i.e. the same as any other project developed in Spain?